ART 331R Module 3b: Project on Visualizing Quantity
In this module, I’ve begun a project to come up with ways to show 100 of something. The final format will be a long, scrollable, Pinterest-style image. I’ve chosen to visualize 100 weeks in various forms.
Below are my process book pages, which show more detail. This module was research, ideation, and sketching.
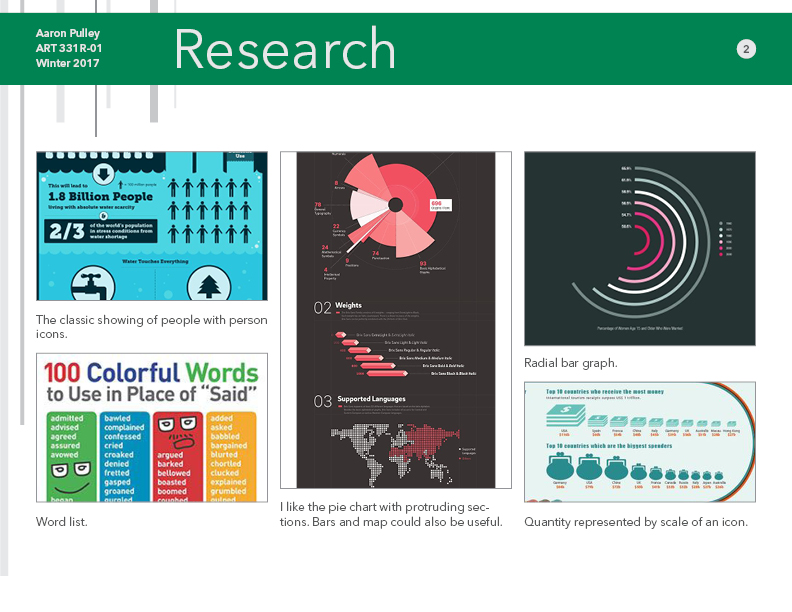
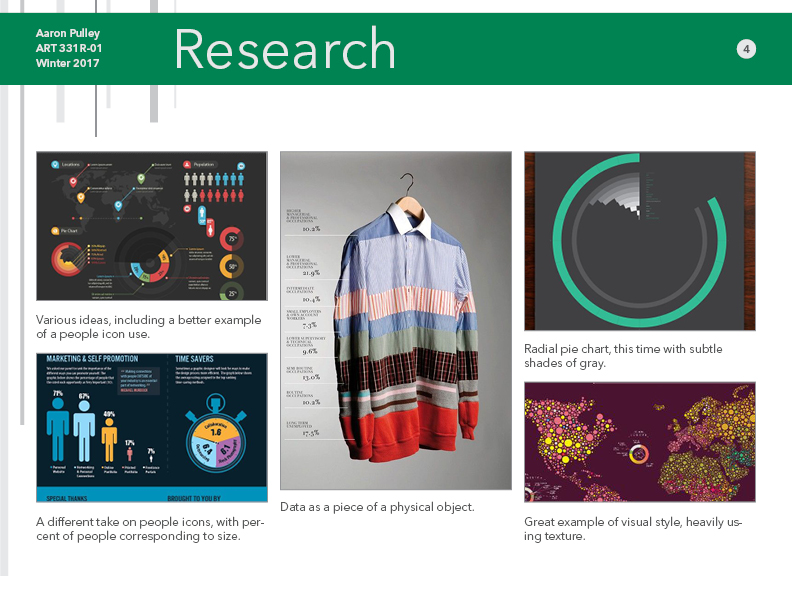
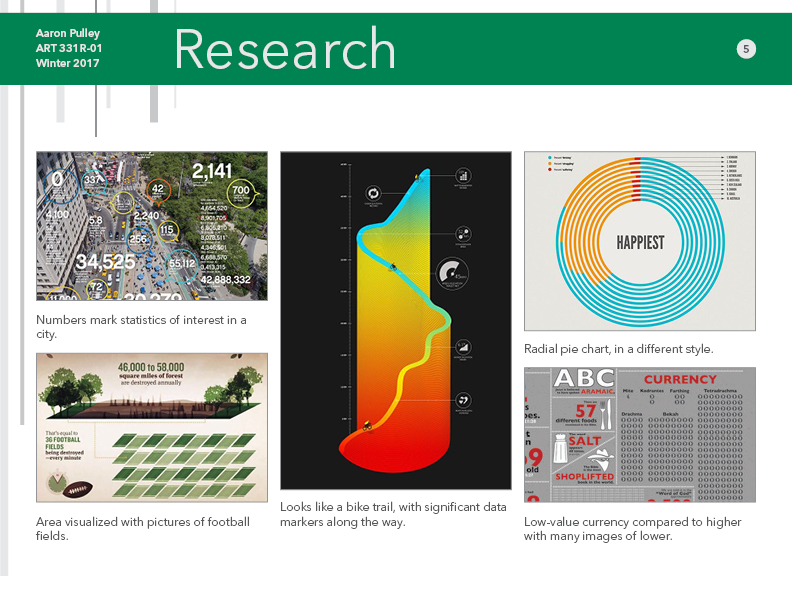
I began by doing research and getting inspiration from other sources.
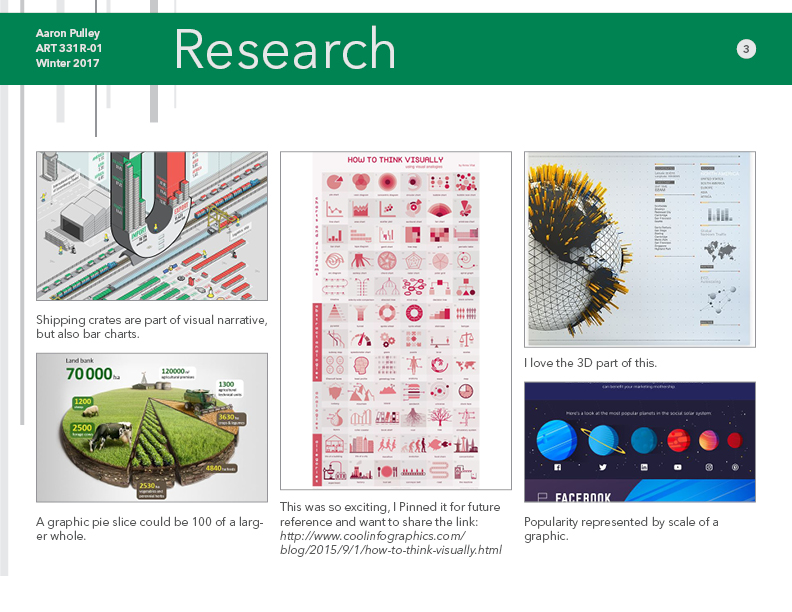
I was particularly excited about the image in the middle of the page below. You can get a better look at coolinfographics.com>.
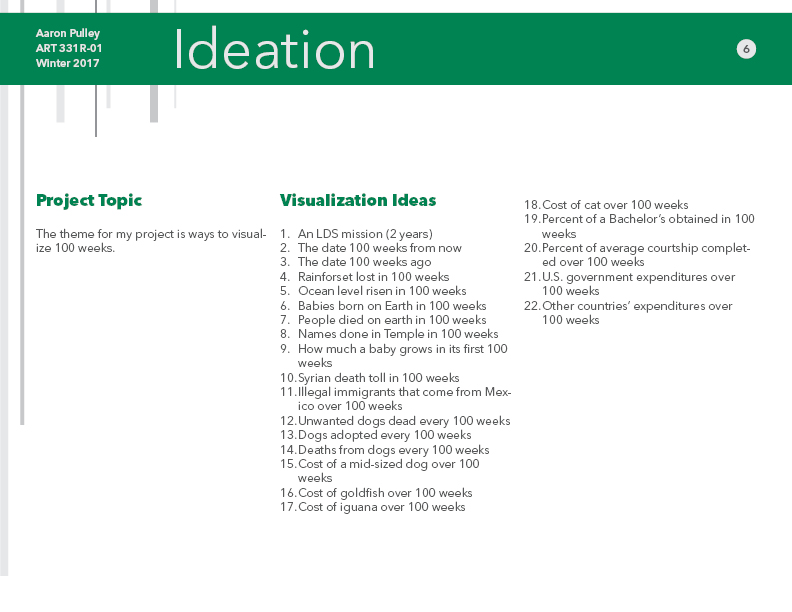
I then chose a topic and began to generate ideas. I really like the idea of doing pairs of opposites, like the number of people born and dead, because I think it could have impact. I also like the idea of doing variations on a theme, like the pet costs, because it has the potential to be useful in a practical way.
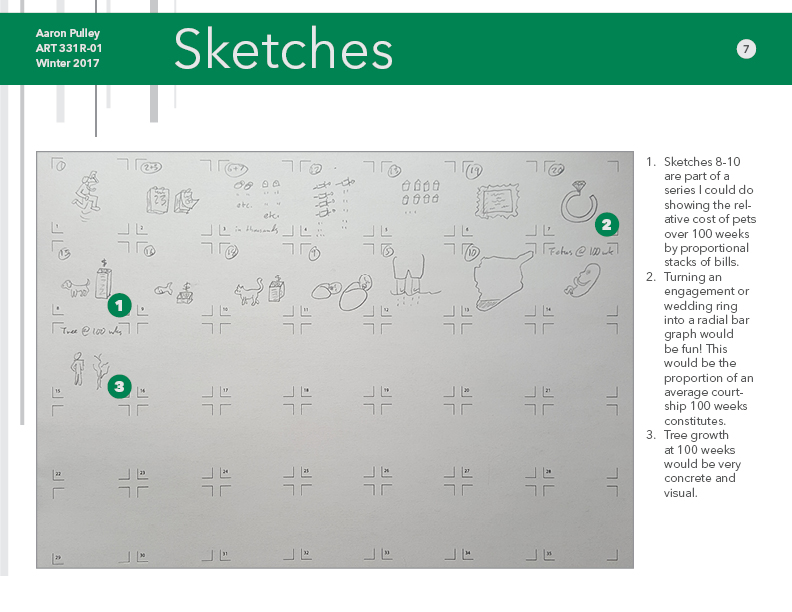
Finally, I sketched out some of my ideas and made them more concrete.